Technical article
The Invisible Threat Beneath Our Cities: How Satellites Are Mapping Ground Risk at Scale
Detecting slow land movement from 693 km away to protect infrastructure
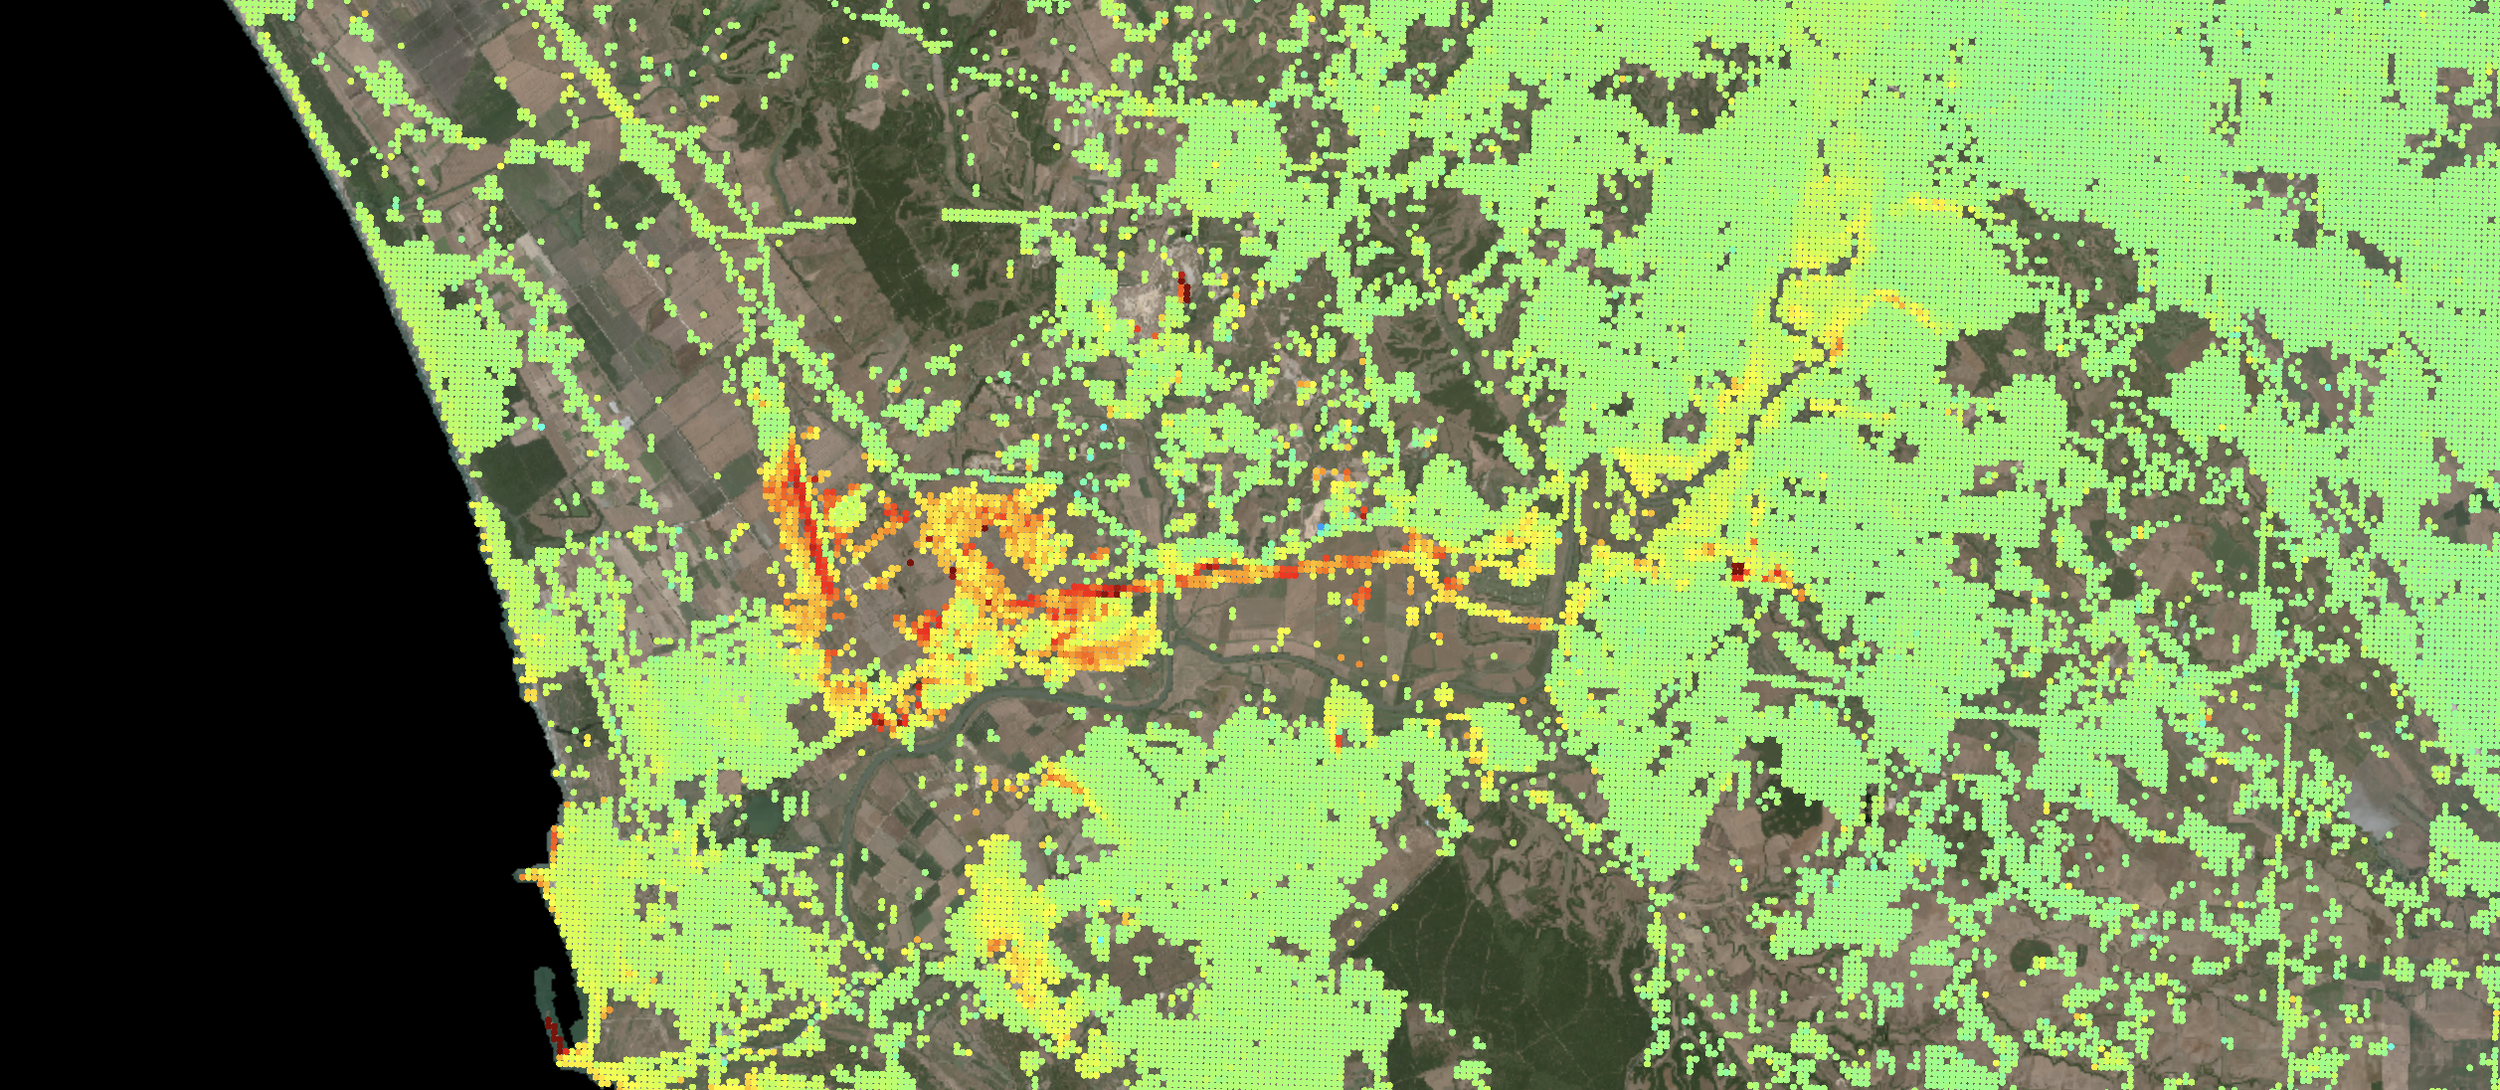
© European Ground Motion Service (EGMS), Copernicus Land Monitoring Service
Satellite-derived ground motion data over Rome's coastal zone, from the European Ground Motion Service. Red and orange areas around Fiumicino airport and the Tiber delta show active subsidence of several millimetres per year, detected by Copernicus Sentinel-1 radar from orbit.
The ground beneath Rome is sinking. So is Amsterdam. And London. And parts of almost every major city built on river deltas, reclaimed land, or above old infrastructure and mines. Most of the time, we only notice when cracks appear in walls or pipes burst. Meanwhile, infrastructure managers, urban planners, and insurers need to assess risk across entire regions, not just single buildings. The cost of not acting in time? Collapsed structures, flooded tunnels, and billions in damages.
But what if we could detect the ground shifting before the damage becomes visible? From 693 km above Earth, the European Union's Sentinel-1 satellites can do exactly that. Working day and night, even through cloud cover, they scan the same patch of Earth every few days and compare the returning radar signals. The technique, called InSAR (Interferometric Synthetic Aperture Radar), reveals subsidence, uplift, and lateral motion that would otherwise remain invisible until something breaks.
Millimetre precision, continent-wide coverage, free to access
The European Ground Motion Service (EGMS), part of the Copernicus Land Monitoring Service, now provides millimetre-scale ground-motion measurements across most of Europe, freely available to anyone. This service provides the first consistent, Europe-wide baseline for tracking how and where the ground is moving.
Copernicus provides the foundation, but it is no longer the only source. Commercial Synthetic Aperture Radar (SAR) microsatellites, built and launched at a fraction of the cost of traditional missions, are adding higher revisit rates and finer resolution. While Sentinel-1 revisits every six days, commercial constellations can image the same spot daily or more, turning periodic snapshots into something closer to continuous surveillance. A spot flagged as high-risk through EGMS can now be tracked in near real-time.
But data alone doesn't prevent disasters. The raw output from these satellites is vast, technical, and largely inaccessible to the people who need it most: urban planners deciding where to build, engineers monitoring ageing infrastructure, and insurers pricing risk across entire regions. The challenge is no longer capturing the data. It's getting it into the right hands.
From more data to more decisions
Turning terabytes of data into clear, actionable insights is not always an easy process, but a new generation of tools and services is making the difference.
In Italy, the national roads authority ANAS uses satellite-derived ground motion data to screen thousands of kilometres of highway for landslide and subsidence risk, helping engineers prioritise where to investigate before something fails.
In the UK, Network Rail has contracted satellite monitoring across Britain's rail network to flag hazardous movement along tracks and the surrounding terrain.
In the Netherlands, the City of Amsterdam uses satellite InSAR to monitor ground displacement along 200 km of historic inner-city canal walls, tracking millimetre-scale movement across structures that would take years to survey by traditional methods.
At the research level, tools like a geohazards impact dashboard presented at ESA's Living Planet Symposium 2025 and developed by satellite engineers and engineering geologists working on Earth Observation at the European Space Agency, go further. The dashboard integrates Copernicus Sentinel-1 ground motion data with national and European geohazard databases and presents it through a map-driven interface, allowing users to screen earthquake, landslide, and subsidence risk across multiple locations at once.
Its core feature is a synthetic GeoHazards Impact Index: a single score combining:
Satellite-observed movement patterns over time
Mapped hazard context from national and European sources
The presence of buildings and infrastructure
The result supports rapid comparison across sites and helps teams focus detailed investigation where it matters most.
The logic is simple: the satellite detects that the ground is moving, the hazard database explains why that matters, and the risk index tells the user what to act on first.
Why this matters now
Europe's risk landscape is shifting in ways that make ground stability harder to ignore. More extreme rainfall is expected to increase landslide hazard in parts of Europe, particularly in mountainous regions, because short, intense rain events can destabilise slopes. Groundwater changes, including drainage practices in soft-soil areas, can accelerate subsidence as the soil gets compressed. At the same time, a lot of Europe's critical infrastructure, such as roads, railways, water networks, and buildings, is ageing, and cities are expanding into areas where the subsurface is complex and poorly understood.
That combination is why ground motion data is moving from a niche tool for geotechnical specialists to a standard input for anyone responsible for managing built assets at scale, from transport authorities to insurers and urban planners.
What comes next
A decade from now, checking satellite-derived ground stability data before building, buying, or insuring a property may be as routine as checking flood zones today. The data is already there. Now it's about using it effectively to build and maintain cities and infrastructure that are more resilient, more predictable to manage, and, most importantly, safer for the people who rely on them every day.